Professor Sue Brooks reflects on the current challenges faced by geographers and environmental managers as we see continual changes to our environment.
Environmental Change
Our constantly changing environment presents many challenges and opportunities for research and education in the Higher Education sector. Climate change is rarely out of the news, issues of environmental pollution and food security have never been more prescient than during the current COVID-19 pandemic, and our collective impact on wildlife will surely be highlighted by an ongoing unprecedented crash in visitor numbers to Areas of Outstanding National Beauty, Sites of Special Scientific Interest and Special Areas of Conservation. One area presenting particular challenges to Geographers and Environmental Managers is that of understanding rates and mechanisms of coastal change under accelerating sea level rise and changing storminess, whether that be through changing storm intensity, magnitude or direction of travel with respect to coastal orientation.
Retreating Cliffs
Understanding coastal and environmental change is something our undergraduates at Birkbeck, studying for BSc degrees in Geography, Environment & Sustainability, are encouraged to engage with throughout their programme. The first question we address is the extent to which our environment is changing. Taking the coast as an example, we can use aerial and ground-based Earth Observation data to develop feature layers for successive periods of time which can be compared and overlaid to assess and quantify change. Take the retreating cliffs of Suffolk shown in Figure 1, where the changing feature is the clifftop edge.
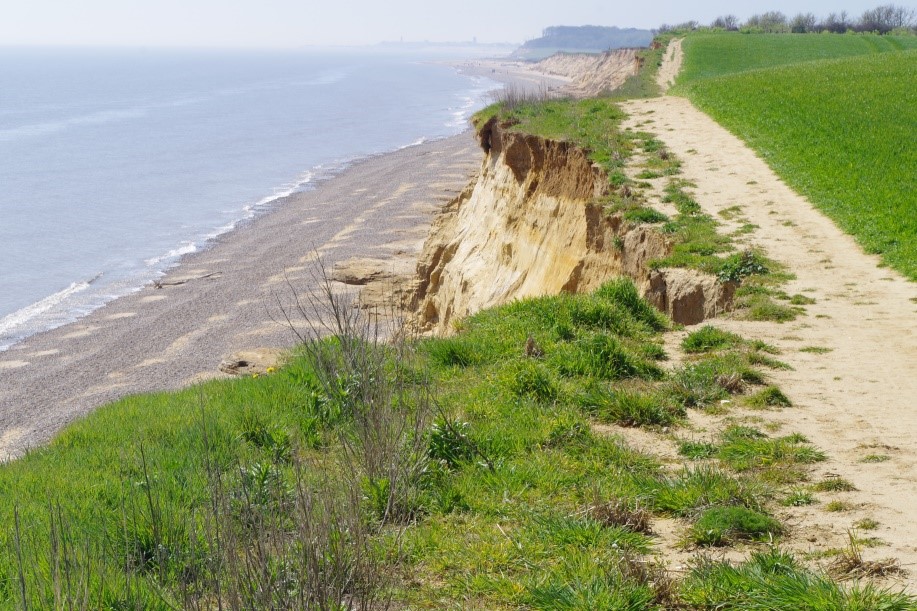
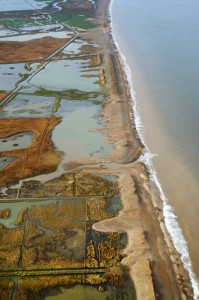
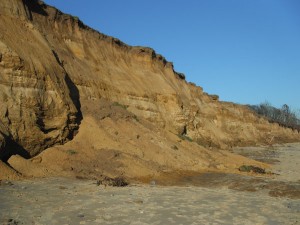
Figure 1: The retreating cliffs at Covehithe Suffolk (7 May 2018) showing evidence of rapid retreat and high process energetics
These cliffs at Covehithe, Suffolk are retreating very quickly as evidenced through the close proximity of the path to the edge, the clean face of the near-vertical cliffs and
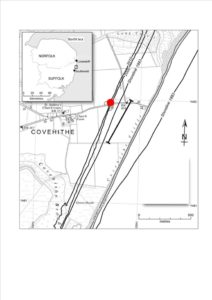
Figure 2: Quantifying shoreline retreat rates over historic and contemporary timescales, using historical maps and aerial photographs. Shorelines are digitized from maps and aerial photos and superimposed on a reproduced 1948 map (shoreline dates from 1947). Red dot indicates the area of figure 1, and solid black line indicates region of detailed shoreline change analysis.
the clifftop edge vegetation indicating instability and the presence of cracks. But how fastare these cliffs retreating? We can address this question by looking at Ordnance Survey historical maps, in this example dating from the 1880s and 1940s. But we can also overlay aerial photos from more recent years, here we use 1993, 2000 and 2010. Expressed in meters of retreat per year (ma-1), the average retreat from 1883 to 1947 was 2-2.5 ma-1 for the cliffline emphasised in bold in figure 2. Ongoing research as part of the BLUEcoast NERC-funded project has quantified a total retreat of 94m between 1993 and 2018 (25 years), at an average annual rate of 3.76 ma-1. The impact of recent high magnitude storms, such as “Beast from the East” and the 2013 North Sea surge reveals as much as 10-12 m of retreat can happen in single events.
Coastal Barriers
Retreating cliffs cannot return to their original locations. They provide a vital source of sediment that is pumped into the nearshore zone during episodes of high retreat and then is recirculated to create mobile barriers elsewhere. This highlights their importance to coastal management and the need to have sound process understanding for future planning. Behind the shoreline barriers diverse habitats thrive, routeways can be maintained and coastal communities are protected. A good example of a shoreline barrier is Blakeney spit, North Norfolk, shown in figure 3.
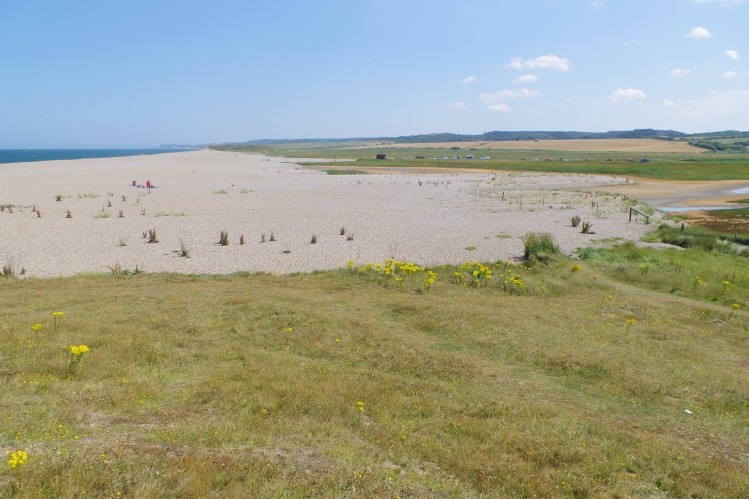
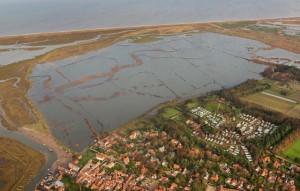
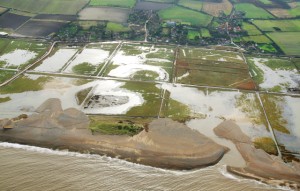
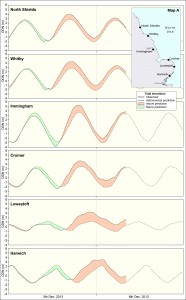
Figure 3: The Blakeney shoreline barrier, North Norfolk showing extensive areas of protected low-lying land behind the barrier. Also shown is an extensive washover feature that resulted from the surge on 5 December 2013 (maximum recorded water levels of 6.30 m ODN (Ordnance Datum Newlyn = approximately mean sea level). Retreating cliffs at Weybourne can be seen in the far distance. (photo: 23 July 2019).
Given sufficient sediment, barriers can grow with sea level rise to be able to withstand to an extent future challenges from storms. However, the largest, intense storms create barrier washover, rollover and breaching. These processes set the shoreline back and can lead to extensive flooding of the back-barrier. The coast exists in a finely balanced state between sediment sources (cliffs) and sinks (barriers), and the processes that connect them. Going forward we need to understand these sources and sinks, their changing locations and their interplay with habitats and communities. Management of coasts requires us to consider the processes that generate and deposit sediment and move it from place to place. At Birkbeck, our Programmes in Geography, Environment & Sustainability include modules that will enhance understanding and skills to address these issues. Consider applying if you want to learn more about our fascinating environment, the way in which it is changing and how to plan for future change.
Sue Brooks is a Professor of Coastal Geoscience in the Department of Geography.
She convenes 3 modules on the BSc Programmes in Geography, Environment & Sustainability:
- Introducing Natural Environments (level 4), 2. Environmental Processes (level 5) and, 3. Storms Seas and Rivers: Hydrology in the field (level 5).
Further information