
This post was contributed by Dr Sue Brooks, Senior Lecturer in Physical Geography in Birkbeck’s Department of Geography, Environment and Development Studies.
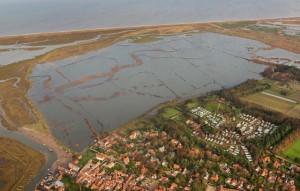
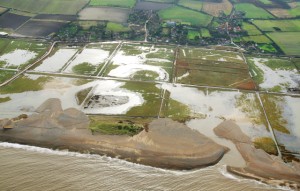
Few people can have failed to notice the high flood incidence over the past few weeks across the UK. One particularly newsworthy event was the storm on 5-6 December 2013 that brought widespread coastal flooding into the southern North Sea and spread destruction across Europe.
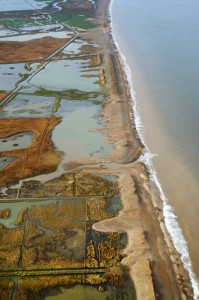
Flooding on the North Norfolk Coast following the storm of 5-6 December, 2013 (photos courtesy of Mike Page)
The worst in 60 years?
The 5-6 December storm forced evacuation of over 10,000 homes in Norfolk and Suffolk, flooded over 1, 400 properties and caused houses to collapse into the sea. It appears to have been the most serious storm for 60 years, following the notorious storm surge of 1953 when over 2000 people lost their lives. But it could happen again next week, next month or next year – so we need to heed the lessons from both events.
Lessons from 1953
So how do these two storm events compare, why did the earlier event lead to such greater human cost and what can new research on the 2013 event tell us?
The 2013 and the 1953 storms arose in similar ways involving deep low pressure systems tracking down the North Sea. But the 1953 event, with eight metre waves, also had devastating consequences because it struck over a weekend. Early warning and evacuation planning were piecemeal, with the radio warning ceasing to transmit from midnight on the Saturday and the offices set to receive telegrams being shut for the weekend. People had very little warning. In 2013, in view of lessons from 1953, the sea encountered strengthened and heightened flood defenses, better early warning and better co-ordinated evacuation planning.
How our research is providing new lessons for early warning and evacuation planning
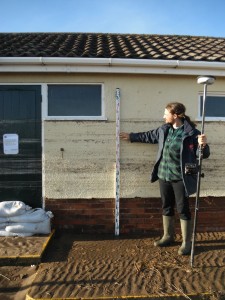
Following the 5-6 December storm we wasted no time recording its coastal impact. A team of researchers from Birkbeck and the University of Cambridge documented water levels around the coast of East Anglia. We used debris drift lines (we had to be quick as the tidy up was swift), erosional notches in banks and cliffs (these are preserved for longer), water marks on buildings and anecdotal evidence from local residents to position the water levels.
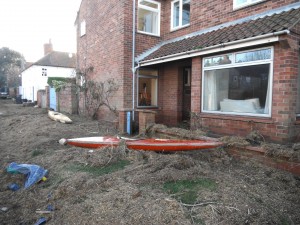
Drift lines and water lines on buildings in the immediate aftermath of the storm recording water elevations at Burnham Overy Staithe, Norfolk (photo taken on 6th December, 2013 by T Spencer)
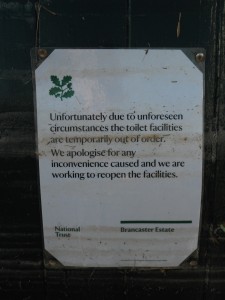
Water line evidence on public toilet block at Brancaster Beach, Norfolk following 5-6 December storm surge (photos taken on 6th December, 2013 by T Spencer)
We used a Global Navigation Satellite System (GNSS) accurate to 20mm to determine the precise water elevations. We found 2013 water levels very similar to those of 1953, and in places 1953 levels were exceeded. More exciting was to find considerable variation in the water level around the coast, about two metres difference in North Norfolk.
Why was the water level so variable?
Water levels recorded in tide gauges in sheltered locations show how the surge level became progressively higher and occurred later as the storm moved southward (see diagram). Surge models can predict this effect and can thereby generate early warning and evacuation procedures against imminent flooding. However, they can only operate at this broad regional scale.
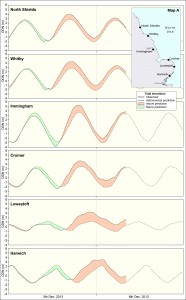
Recorded and predicted water level at locations along the east coast of UK, 5th-6th December 2013 (based upon data from the National Tidal and Sea Level Facility, provided by the British Oceanographic Data Centre and funded by the Environment Agency)
Strong, persistent winds generate high waves, also a factor in coastal damage. Waves were four metres at the Blakeney overfalls wave rider buoy (10 km offshore). Waves are considerably modified by the coastal setting. Along the North Norfolk Coast they were able to add significant force on top of already elevated water levels.
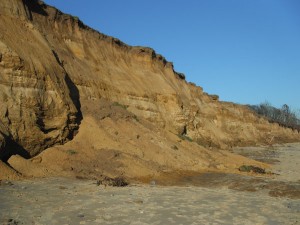
The collapsing cliffs at Covehithe, Suffolk (research will quantify the land loss in the 5-6 December, 2013 storm surge) (photo taken on 11th December, 2013 by SM Brooks)
Further around the coast in Suffolk we found evidence for cliff erosion, arising from wave action at the cliff base (Brooks et al., 2012). Our initial findings suggest that water levels and wave action reached almost four metres ODN (Ordnance Data Newlyn, which approximates to mean sea level), producing notching and cliff collapse. Loss of land and homes through cliff retreat is irreversible and cliff retreat can continue long after the surge event has happened.
What lessons can we take forward from 2013?
- Water elevation differences affect a property’s flood risk.
- Homes and businesses need to have information on their specific vulnerability.
- Models provide general predictions of timing of surges and open sea water levels.
- We don’t currently consider how surges interface with the coastal setting encountered.
From 2013 we have now learnt that in coastal settings such as North Norfolk and Suffolk, the barrier islands, dunes and gravel spits, interspersed with tidal inlets with marshes and mudflats and separated by eroding cliffs make for huge variability in the potential for the sea to ingress and flood land, as well as to cause cliff retreat through wave action.
Our results show there are still lessons to be learned that could help prevent future societal and environmental damage that accompanies storm surges.
The team’s initial assessment is published in Nature and further information is available here.

I do agree with all of the ideas you have introduced in your post. They are very convincing and will definitely work. Nonetheless, the posts are very short for newbies. May just you please prolong them a little from next time? Thank you for the post.