Author Archives: Rebekah

‘A world turned upside down: COVID-19, urban poverty and older people in Chennai, an Indian metropole’.

Dr Penny Vera Sanso, a Senior Lecturer in the Department of Geography reflects on the COVID-related suffering that will be detrimental to Chennai’s poor.

The expectation is COVID-19 will run wild through the high density low-income settlements that Chennai’s poor are forced to live in.  This may yet happen. What is happening is a great deal of COVID-related suffering, including excess deaths, deepening impoverishment and changing intergenerational relations that will force some older people into greater dependency and marginalization and others into more depleting economic engagements.

Currently the greatest threat for people living in low-income settlements is COVID-related impacts. How is this possible?

  • First, India is a highly segregated society. Segregated by class, caste and labour conditions, in which 90% of workers have no rights, most are employed on daily or piece rates. There are few points of contact that would provide person-to-person spread between slum dwellers and the ‘flying classes’ who brought the disease to India on flights from Wuhan, UAE, Italy and so on. Further, the longstanding stigmatization of slum dwellers and low caste people as sources of contagion, which underpins widespread Human Rights abuses in India, meant that the people most likely to be carrying the disease, the Middle Classes, shut off all direct contact with those least likely to have it, slum dwellers.
  • Second, India implemented a lockdown on the 25 March, when it only had 519 cases, quarantining tourists, banning international commercial flights and suspending train services.
  • Third, it established Containment Zones for any buildings or areas with one or more confirmed cases. Containment is backed up with targeted testing and tracing. As of 29 April 2020 there were 170 containment zones across India and 1075 deaths.  In this no-one can leave their homes: groceries are delivered through government channels. The lockdown and containment are stringently policed, often heavy-handedly.

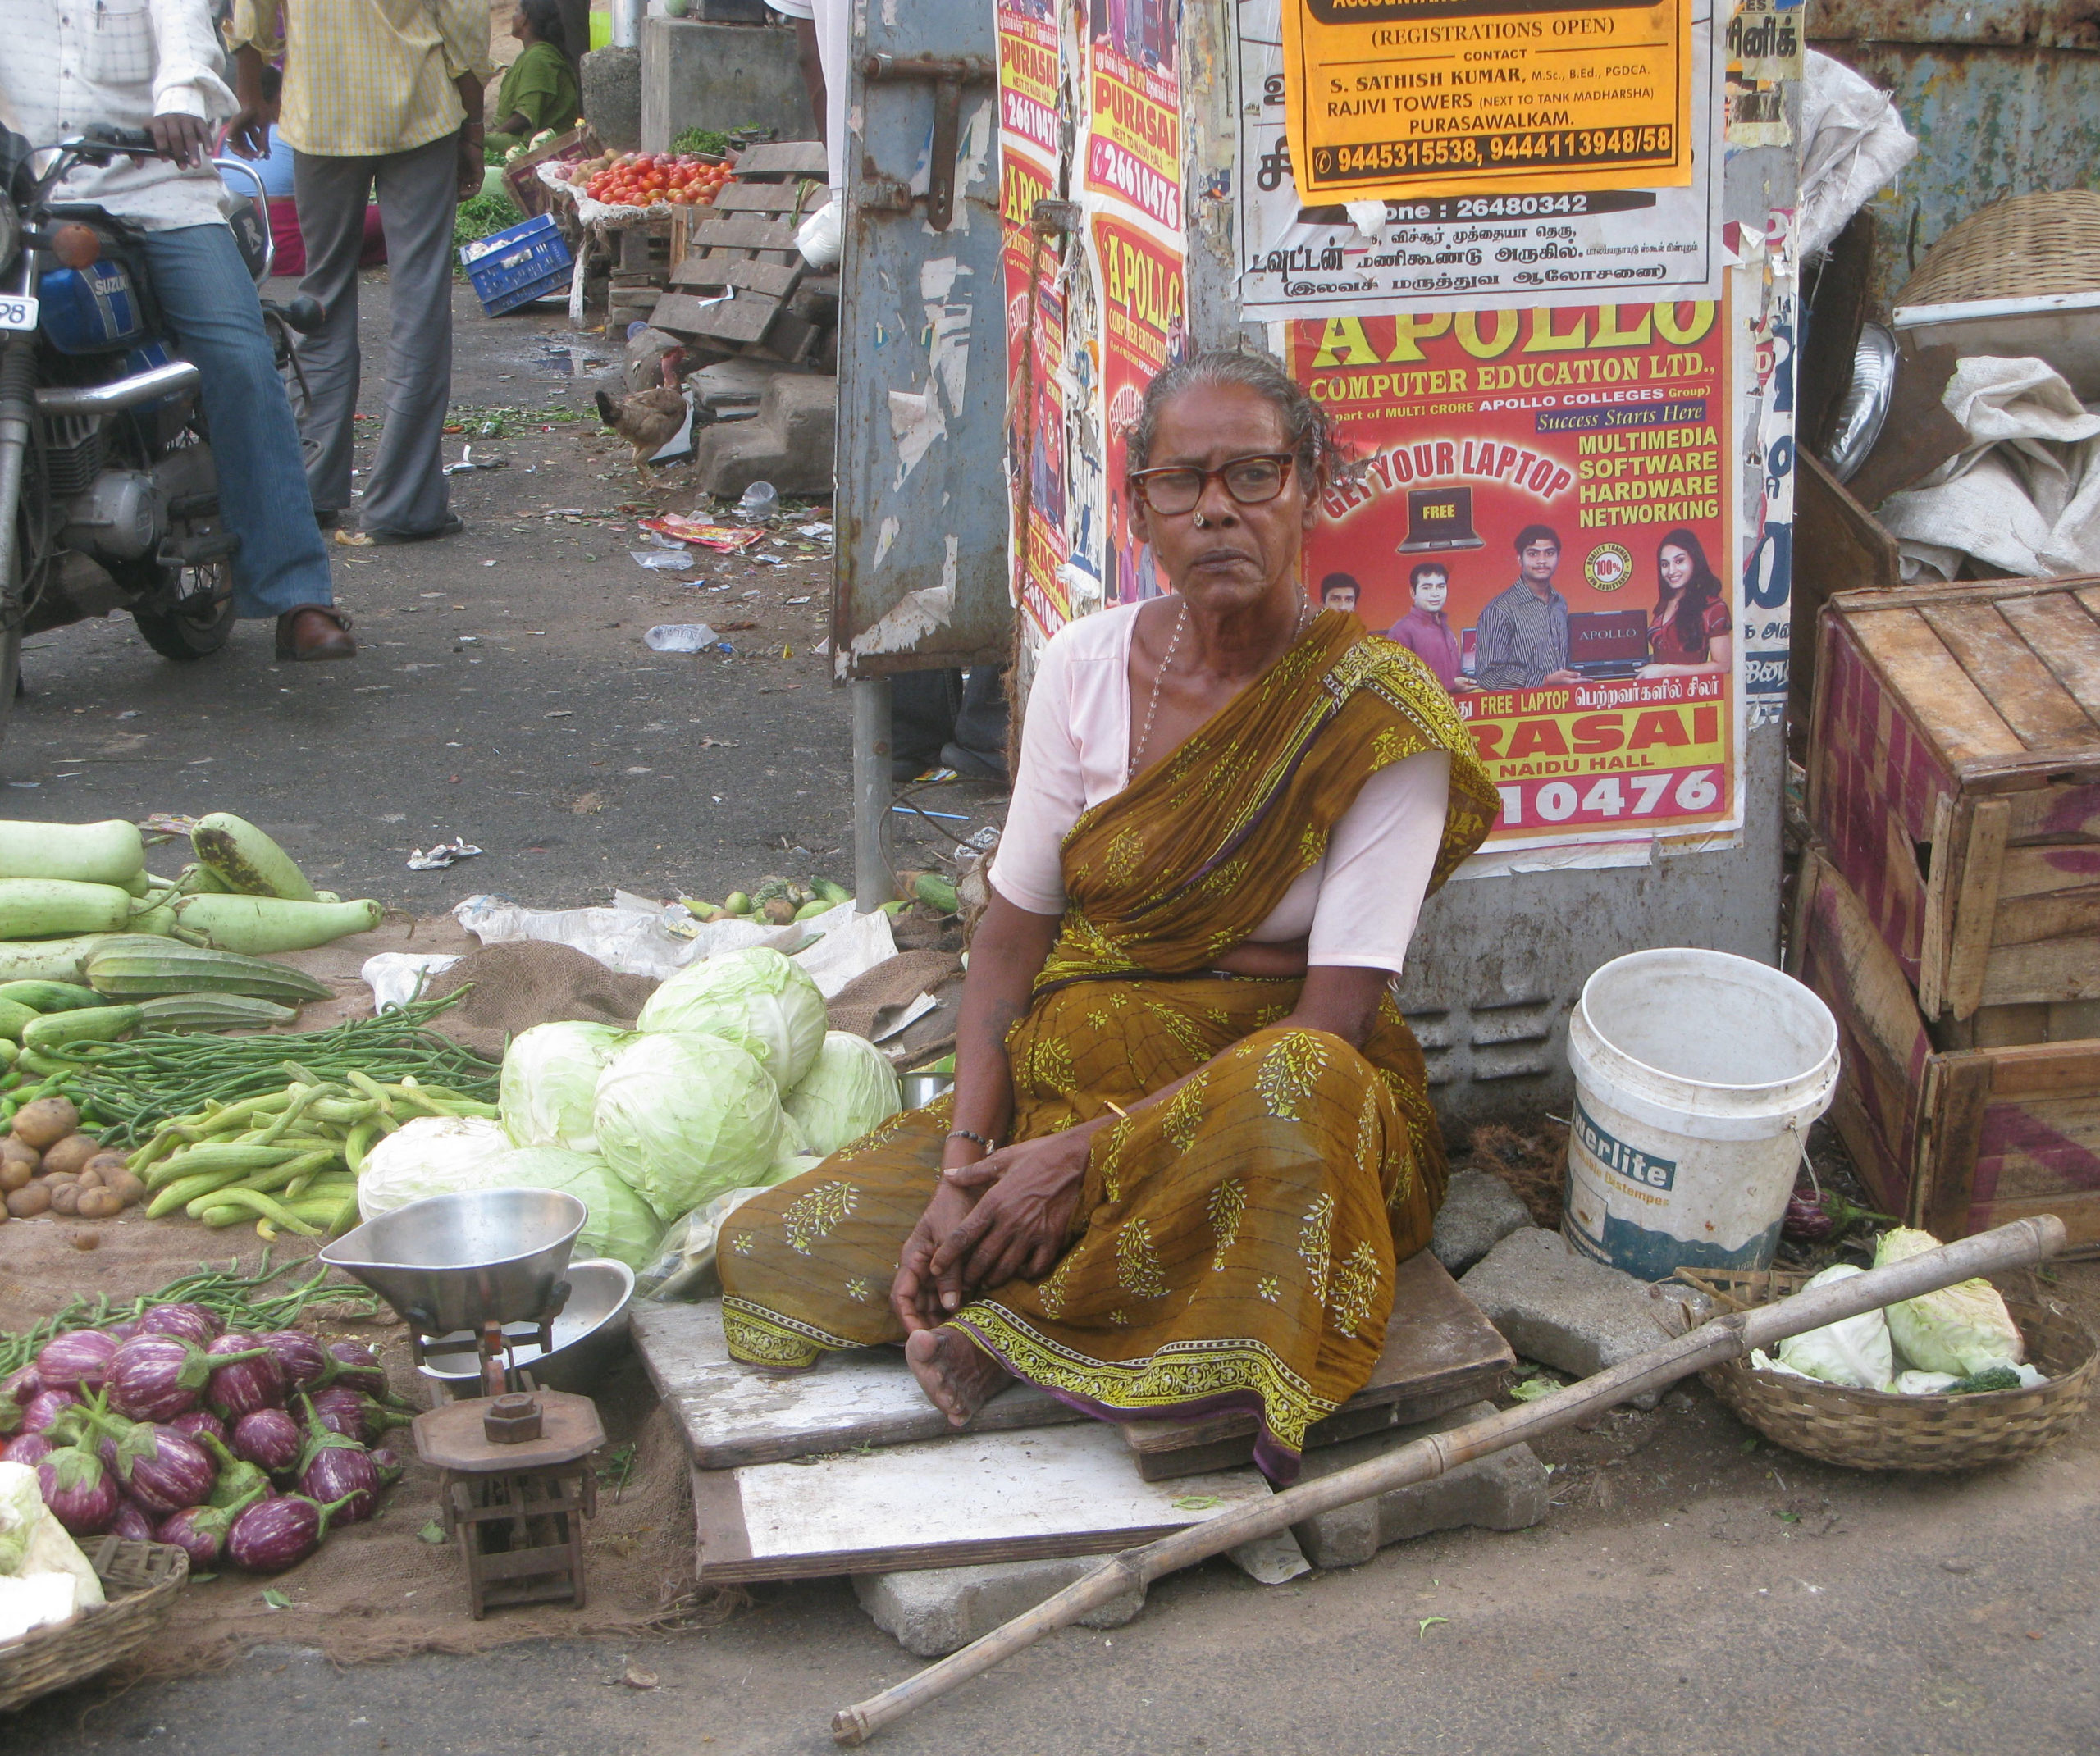
For most of the urban poor COVID-19 has brought their economic lives to a standstill. Research undertaken in five Chennai slums between 2007-10, including the 2008 international banking crisis, that translated into a significant economic slow down in Chennai, is instructive.  Chennai’s labour market is segregated by age, gender and education, and has until now provided considerable economic space for older people, who occupied areas of the economy that younger people had vacated for higher status, easier conditions and better pay.

People on low, insecure, daily incomes do not earn enough to save. There is no question that after six weeks without work everyone in Chennai’s low-income settlements, whose nutritional status would not have been good, anaemia and malnutrition being endemic, will have cut food expenditures to the bone.

Beyond this, the wider context impinges on people’s health and capacity to seek healthcare. Water shortages and temperatures ranging from 34 deg C to 40 deg C contribute to dehydration and heat stroke. Free health services are centrally located, hence inaccessible for most people, while private doctors and medication need to be paid for. All this in a context where male slum dwellers already have a life expectancy of 5 years less than non-slum dwellers, reflecting globally established social gradients in morbidity and mortality.

For the urban poor starvation, non-COVID-19 sickness and deepening vulnerability are currently the greatest dangers they face; these will drive them back into finding work, often servicing those classes and sectors who comprise the current pool in which COVID-19 swims.  Hunger will bring the virus to the slums.

In this world turned upside down, the poor are, currently, much more at risk from excess, COVID-related deaths than COVID-19 itself.  Loss of health, assets, jobs, housing and the disruption of social and economic networks beyond their settlements are the immediate impacts of lockdown.  There will be mid and long term impacts.

At best mid-term impacts will be relatively short lived, requiring greater labour force participation for everyone in low-income settlements – but not the ‘pull your socks up’ participation that neo-liberal economists like to think will raise household incomes.  People of all ages and abilities will be forced onto the labour market, lowering pay rates.  Older women and men, a higher percentage of whom are already in paid work than are people aged 15-19, will be forced into even more body depleting hours and conditions on less pay, in a context in which age discrimination in employment and wages is well established.  Family and kin networks will develop holes due to the underlying health conditions, deepening nutritional deficits and untreated morbidity under COVID-19 conditions and directly from COVID-19 if it spreads through the slums.

Tamil Nadu is a state with a comparatively low fertility rate. COVID-19’s direct and indirect consequences will sharpen the long-term risks of reducing the size of family networks in the context of weak state support.

Older people with small, depleted or no family, with no or inadequate pensions or who have lost work will find their capacity to cater for themselves or to rely on others significantly constrained. They could well become even more tied into impoverished family networks that increasingly depend on older people’s inputs.

There is no getting away from the need for a realistic income for all people over age 60 and a pension programme that guarantees such.

Irrespective of whether COVID-19 finds spreads through Chennai’s low-income settlements or not, excess COVID-related deaths are a certainty.  It will be political will that determines whether these deaths and the pandemic’s long-term impacts on people living in low-income settlements will ever be recognized for what they are: the consequence of how India chooses to distribute its risks across society.

Share

Challenges for Environmental Studies in a changing world

Professor Sue Brooks reflects on the current challenges faced by geographers and environmental managers as we see continual changes to our environment.

Environmental Change

Our constantly changing environment presents many challenges and opportunities for research and education in the Higher Education sector. Climate change is rarely out of the news, issues of environmental pollution and food security have never been more prescient than during the current COVID-19 pandemic, and our collective impact on wildlife will surely be highlighted by an ongoing unprecedented crash in visitor numbers to Areas of Outstanding National Beauty, Sites of Special Scientific Interest and Special Areas of Conservation. One area presenting particular challenges to Geographers and Environmental Managers is that of understanding rates and mechanisms of coastal change under accelerating sea level rise and changing storminess, whether that be through changing storm intensity, magnitude or direction of travel with respect to coastal orientation.

Retreating Cliffs

Understanding coastal and environmental change is something our undergraduates at Birkbeck, studying for BSc degrees in GeographyEnvironment & Sustainability, are encouraged to engage with throughout their programme. The first question we address is the extent to which our environment is changing. Taking the coast as an example, we can use aerial and ground-based Earth Observation data to develop feature layers for successive periods of time which can be compared and overlaid to assess and quantify change. Take the retreating cliffs of Suffolk shown in Figure 1, where the changing feature is the clifftop edge.

Figure 1: The retreating cliffs at Covehithe Suffolk (7 May 2018) showing evidence of rapid retreat and high process energetics

Figure 1: The retreating cliffs at Covehithe Suffolk (7 May 2018) showing evidence of rapid retreat and high process energetics

These cliffs at Covehithe, Suffolk are retreating very quickly as evidenced through the close proximity of the path to the edge, the clean face of the near-vertical cliffs and

A historical map/aerial photograph

Figure 2: Quantifying shoreline retreat rates over historic and contemporary timescales, using historical maps and aerial photographs. Shorelines are digitized from maps and aerial photos and superimposed on a reproduced 1948 map (shoreline dates from 1947). Red dot indicates the area of figure 1, and solid black line indicates region of detailed shoreline change analysis.

the clifftop edge vegetation indicating instability and the presence of cracks. But how fastare these cliffs retreating? We can address this question by looking at Ordnance Survey historical maps, in this example dating from the 1880s and 1940s. But we can also overlay aerial photos from more recent years, here we use 1993, 2000 and 2010. Expressed in meters of retreat per year (ma-1), the average retreat from 1883 to 1947 was 2-2.5 ma-1 for the cliffline emphasised in bold in figure 2. Ongoing research as part of the BLUEcoast NERC-funded project has quantified a total retreat of 94m between 1993 and 2018 (25 years), at an average annual rate of 3.76 ma-1. The impact of recent high magnitude storms, such as “Beast from the East” and the 2013 North Sea surge reveals as much as 10-12 m of retreat can happen in single events.

Coastal Barriers

Retreating cliffs cannot return to their original locations. They provide a vital source of sediment that is pumped into the nearshore zone during episodes of high retreat and then is recirculated to create mobile barriers elsewhere. This highlights their importance to coastal management and the need to have sound process understanding for future planning. Behind the shoreline barriers diverse habitats thrive, routeways can be maintained and coastal communities are protected. A good example of a shoreline barrier is Blakeney spit, North Norfolk, shown in figure 3.

The Blakeney shoreline barrier

Figure 3: The Blakeney shoreline barrier, North Norfolk showing extensive areas of protected low-lying land behind the barrier. Also shown is an extensive washover feature that resulted from the surge on 5 December 2013 (maximum recorded water levels of 6.30 m ODN (Ordnance Datum Newlyn = approximately mean sea level). Retreating cliffs at Weybourne can be seen in the far distance. (photo: 23 July 2019).

Given sufficient sediment, barriers can grow with sea level rise to be able to withstand to an extent future challenges from storms. However, the largest, intense storms create barrier washover, rollover and breaching. These processes set the shoreline back and can lead to extensive flooding of the back-barrier. The coast exists in a finely balanced state between sediment sources (cliffs) and sinks (barriers), and the processes that connect them. Going forward we need to understand these sources and sinks, their changing locations and their interplay with habitats and communities. Management of coasts requires us to consider the processes that generate and deposit sediment and move it from place to place. At Birkbeck, our Programmes in Geography, Environment & Sustainability include modules that will enhance understanding and skills to address these issues. Consider applying if you want to learn more about our fascinating environment, the way in which it is changing and how to plan for future change.

Sue Brooks is a Professor of Coastal Geoscience in the Department of Geography.

She convenes 3 modules on the BSc Programmes in Geography, Environment & Sustainability:

  1. Introducing Natural Environments (level 4), 2. Environmental Processes (level 5) and, 3. Storms Seas and Rivers: Hydrology in the field (level 5).

Further information


Share