
Written by Dr Nancy Doyle.
Co-director of the Centre for Neurodiversity at Work, Dr Nancy Doyle is a Research Fellow at Birkbeck, Chartered Psychologist in organisational and occupational psychology, and the founder and owner of Genius Within CIC, a social enterprise dedicated to facilitating neurodiversity inclusion.
Real world data is essential
Applied field research is really difficult – data can be messy and full of contradictions. I realised in my doctoral research that data from a large field study didn’t make sense. I wanted to flip open the ‘black box’ of coaching (Nielsen & Randall, 2013) to understand how being coached could improve the work performance of dyslexic adults in the workplace. My pilot studies had shown a large increase in self-rated and manager-rated performance (Doyle & McDowall, 2015). Support for dyslexic adults is much needed as they are at significant increased risk of career limitations, unemployment and incarceration than the general population (Jensen et al., 2000; Snowling et al., 2000). I wanted to find out how coaching changes their self-beliefs, their stress levels and their behaviour
Real world data is hard to collect
So, I had before-, immediately after- and 3-months after coaching data from 67 dyslexic adults, split into three cohorts of wait-list control, one-to-one coaching and group coaching. I had a working memory score, a generalised self-efficacy score, a stress indicator and a workplace behaviour score for each. Bonferroni corrections for multiple comparisons (Perrett & Mundfrom, 2010) were somewhat disabling. All my intervention group means headed in the same direction – up! But the three x time, three x condition, four x dependent variable with the 67 people (down from 85 at the start) was just not powerful enough to get a conclusive result. My control group had practice effects (grrr) which waned by the third interval but ruined the time 2 analysis. My one-to-one coaching participants had a sustained uplift from time two to time three and my group coaching condition went up at time two and then up again at time three. I was none the wiser as to how coaching might improve the difficulties associated with dyslexia at work.
Real-world data is messy
We considered if the measures were faulty. The strongest result had come from using backward digit span in the Weschler Adult Intelligence Scale (Weschler, 2008). The group coaching condition had increased from an average of seven to eleven (the standardised score ranges from 1-19; the average is 8-12; practice effects are reported by the publisher to be 0.6). Yet this score was still not significant following Bonferroni corrections. The self-efficacy scores initially went backwards for the coaching conditions. We wondered if this was some sort of methodological artefact; or perhaps it reflected an increased self-awareness of struggles. However, they recovered by time three. Perhaps a more workplace-focused self-efficacy scale would be more effective? With the behavioural measures, these were designed by me and, though their reliability analyses were decent, we wondered if we should use an established scale of strategies. So, I decided to re-run the study. All studies were triple-blinded – testers didn’t know to which condition testees were assigned, coaches didn’t know test scores and I didn’t know which condition was which until after I had done the analysis.
You can imagine my delight, six months later, when I had almost identical results from my second cohort of 52 dyslexic adults (this time split into group coaching and control only). Control group practice effects at time two, persistent increases from the intervention group but not powerful enough to placate Bonferroni. So I undertook some ‘abductive reasoning’ (Van Maanen et al., 2007) to try and understand the results. This is when I noted a conundrum – a pattern in the data that shouldn’t be there if it was a straightforward null result.
Real-world people don’t respond in a homogenous way
Looking solely at the time three minus the time one scores (total distance travelled, or the “magnitude of the effect”) the means for each measure went in the same direction. Up for the intervention groups, slightly up for controls. But they were not correlated. How could this be? Why would there be consistency at the group level (as measured by the group means) analysis but no consistency at the individual level (correlation works by assessing the consistency of paired trajectories for each participant)? There is only one answer – the group means were masking significant disparities for individuals within each group. Now, this is where is gets technical. I tried a person-centred cluster analysis (Morin et al., 2018). In the working memory variable, I found distinct cohorts, a bi-modal distribution for the intervention group:
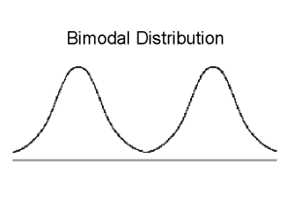
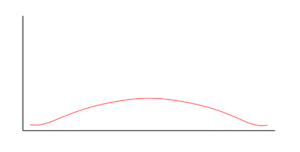
Some of them scored similarly to the control – a zero to small uplift, probably a practice effect. Others increased dramatically. In the other measures, I found a platykurtic distribution of improvement, some similar to the control, a bit ‘meh’, a bit more, increasing to quite reasonable and then quite large levels of improvement:
Group effect measures versus individual effects variance
But these were not the same people, which is why the correlations were not significant. In other words, some coachees had improved on working memory, some on levels of stress, some on self-efficacy and some on implementation of behavioural strategies. The coachees had taken what they wanted from the coaching, and not invested their personal development resources in the other mechanisms of change. The group level of analysis had wiped out variability in response-to-treatment and masked the impact of the coaching. This has implications for research, which is broadly dependent on the framework of null hypothesis significance tests. T-tests, ANOVAs, MANOVAs – all these depend on some sort of consistency within the group. Psychological research depends on isolating a potential variable, measuring it for each individual in a group, and crossing our fingers that the group will all behave in a similar enough way to achieve the hallowed ground of a significant p-value. But humans don’t behave in similar ways, even if they are broadly similar in age, diagnosis, employer, job role. I started wondering how many psychological approaches were ignoring the individual variability in treatment responses in favour of what works best for the dominant average, and ignoring the needs of those who don’t respond or respond negatively: mindfulness, I am looking at YOU (Farias & Wikholm, 2016).
Personalised pathways, group effect: meta-impact
We decided that there should be a way to understand whether or not an intervention has a good chance of working in some way for most rather than the one mechanism that will often work in the same way for many. To do this, I constructed a method for demarcating a significant improvement at the individual level which could be then re-aggregated at the group level across all the dependent variables. I deemed my participants to have improved if they improved to equal / more than one standard deviation above the average level of improvement for the cohort. This reduced the number of people who could be improved, marked a line in the sand for my platykurtic distributions and isolated the improvers in the bimodal distribution. When I had a binary yes/no score for improvers I could then add up how many improvers there were in the intervention groups and how many there were in the control groups. And bingo! The intervention groups produced significantly more improvers than the controls. This could be analysed using odds-ratio, ANOVA, t-tests or non-parametric equivalents (Doyle et al., 2022).
Going into my PhD viva with a novel statistical method of analysis was a risk. However, after a decent grilling, my examiners concurred that the method was empirically sound. Almuth and Dr Ray Randall, my external examiner, helped corral the study into a single paper. Getting it past journal reviewers was another matter! Those with statistical pedigree seemed affronted at the “arbitrary dichotomization” but offered several avenues for statistical exploration which I undertook, leading me to a place where I am way more familiar with mathematical reasoning than is comfortable for most social scientists! I enhanced the Maths and roped in a mathematician, Dr Kate Knight, to lay out the process in algebraic formulae. Job done? Nope. Those with field study experience loved the idea, but struggled with the Maths. Grr. Eventually, a multi-disciplinary journal, PLOSONE, found an editor and some anonymous reviewers who could see the pragmatic, realist need for expanding the methods available to field researchers and after a year of wrangling it was published on the 17th March 2022.
Real world data needs real world analytic method
What does this mean? My editor, Dr Ashley Weinberg, suggested that the meta-impact analysis of interventions has the potential to increase our understanding of psychological interventions in situ, giving boost to field researchers. There are still limitations. For example, we need to understand more about the cut-off point- the method needs to be replicated in tandem with qualitative study to explore whether it chimes with self-reports of experience and real world value. I know many research students and field researchers will empathise with my plight. There is a general sentiment in organisational psychology that we are hampered in research by participant attrition and low power, which leads us to design studies that have the most chance of a successful result, even though this limits us to basic designs or using large cohorts in ways that don’t match reality. My hope is that we can use meta-impact analysis to bring more ecological validity to our work as psychologists and embed nuance for individuals into study designs.
References
Dixon, R. A., & Hultsch, D. F. (1984). The Metamemory in Adulthood (MIA) instrument. Psychological Documents, 14(3).
Doyle, N., & McDowall, A. (2021). Diamond in the rough? An ‘empty review’ of research into ‘neurodiversity’ and a road map for developing the inclusion agenda. Equality, Diversity and Inclusion: An International Journal, published. https://doi.org/10.1108/EDI-06-2020-0172
Doyle, N.E., & McDowall, A. (2019). Context matters: A review to formulate a conceptual framework for coaching as a disability accommodation. PLoS ONE, 14(8). https://doi.org/10.1371/journal.pone.0199408
Doyle, N.E., Mcdowall, A., Randall, R., & Knight, K. (2022). Does it work ? Using a Meta-Impact score to examine global effects in quasi-experimental intervention studies. PLoS ONE, 17(3), 1–21. https://doi.org/10.1371/journal.pone.0265312
Doyle, N., & McDowall, A. (2015). Is coaching an effective adjustment for dyslexic adults? Coaching: An International Journal of Theory and PracticeCoaching: An, 8(2), 154–168. https://doi.org/10.1080/17521882.2015.1065894
Farias, M., & Wikholm, C. (2016). Has the science of mindfulness lost its mind ? British Journal of Psychology Bulletin, 40, 329–332. https://doi.org/10.1192/pb.bp.116.053686
Jensen, J., Lindgren, M., Andersson, K., Ingvar, D. H., & Levander, S. (2000). Cognitive intervention in unemployed individuals with reading and writing disabilities. Applied Neuropsychology, 7(4), 223–236. https://doi.org/10.1207/S15324826AN0704_4
King, E. B., Hebl, M. R., Morgan, W. B., & Ahmad, A. S. (2012). Field Experiments on Sensitive Organizational Topics. Organizational Research Methods, 16(4), 501–521. https://doi.org/10.1177/1094428112462608
McLoughlin, D., & Leather, C. (2013). The Dyslexic Adult. Chichester: John Wiley and Sons.
Morin, A., Bujacz, A., & Gagne, M. (2018). Person-Centered Methodologies in the Organizational Sciences : Introduction to the Feature Topic. 21(4), 803–813. https://doi.org/10.1177/1094428118773856
Nielsen, K., & Randall, R. (2013). Opening the black box: Presenting a model for evaluating organizational-level interventions. European Journal of Work and Organizational Psychology, 22(5), 601–617. https://doi.org/10.1080/1359432X.2012.690556
Perrett, J. J., & Mundfrom, D. J. (2010). Bonferroni Procedure. In N. J. Salkind (Ed.), Encyclopedia of Research Design (pp. 98–101). Sage Publications Ltd.
Santuzzi, A. M., Waltz, P. R., Finkelstein, L. M., & Rupp, D. E. (2014). Invisible disabilities: Unique challenges for employees and organizations. Industrial and Organizational Psychology, 7(2), 204–219. https://doi.org/10.1111/iops.12134
Snowling, M. J., Adams, J. W., Bowyer-Crane, C., & Tobin, V. A. (2000). Levels of literacy among juvenile offenders: the incidence of specific reading difficulties. Criminal Behaviour and Mental Health, 10(4), 229–241. https://doi.org/10.1002/cbm.362
Van Maanen, J., Sørensen, J. B., & Mitchell, T. R. (2007). The interplay between theory and method. Academy of Management Review, 32(4), 1145–1154. https://doi.org/10.5465/AMR.2007.26586080
Weschler, D. (2008). Weschler Adult Intelligence Scale version IV. Pearson.
More information:
- Find out more about the Centre for Neurodiversity at Work